Alteration minerals and silicification are typically associated with a variety of ore mineralizations and could be detected using multispectral remote sensing sensors as indicators for mineral exploration. In this investigation, the Visible Near-Infra-Red (VNIR), Short-Wave Infra-Red (SWIR), and Thermal Infra-Red (TIR) bands of the ASTER satellite sensor derived layers were fused to detect alteration minerals and silicification in east the Kerdous inlier for cupriferous mineralization exploration. Several image processing techniques were executed in the present investigation, namely, Band Ratio (BR), Selective Principal Component Analysis (SPCA) and Constrained Energy Minimization (CEM) techniques. Initially, the BR and SPCA processing results revealed several alteration zones, including argillic, phyllic, dolomitization and silicification as well as iron oxides and hydroxides. Then, these zones were mapped at sub-pixel level using the CEM technique. Pyrophyllite, kaolinite, dolomite, illite, muscovite, montmorillonite, topaz and hematite were revealed displaying a significant distribution in relation with the eastern Amlen region lithological units and previously detected mineral potential zones using HyMap imaging spectroscopy. Mainly, a close spatial association between iron oxides and hydroxide minerals, argillic, and phyllic alteration was detected, as well as a strong silicification was detected around doleritic dykes unit in Jbel Lkest area. A weighted overlay approach was used in the integration of hydrothermal alteration minerals and silicification, which allowed the elaboration of a new mineral alteration map of study area with five alteration intensities. ASTER and the various employed processing techniques allowed a practical and cost effective mapping of alteration features, which corroborates well with field survey and X-ray diffraction analysis. Therefore, ASTER data and the employed processing techniques offers a practical approach for mineral prospection in comparable settings.
The Advanced Spaceborne Thermal Emission and Reflection Radiometer (ASTER) multispectral sensor on-board the Earth Observing System (EOS) of TERRA satellite, it was launched on December 18, 1999 (Fujisada 1995). ASTER presents a spectral coverage with 14 bands in VNIR (15-m Ground Sampling Distance (GSD)), SWIR (30-m GSD), and TIR (90-m GSD) regions. Spectrally, iron oxide/hydroxide and hydroxyl-bearing mineral groups present diagnostic spectral absorption features due to electronic processes of transition elements (Fe2+, Fe3+ and REE) and vibrational processes of fundamental absorptions of Al–OH, Mg–OH, Fe–OH and Si–OH could be depicted in VNIR and SWIR regions (Pour et al., 2021). These mineral groups can be detected using three VNIR and six SWIR spectral bands of ASTER. Furthermore, five TIR bands of ASTER are capable of depict silicate lithological groups following distinct characteristics of the emissivity spectra derived from Si–O–Si stretching vibrations in the TIR region (Abrams 2000; Pour and Hashim 2012a). Various hydrothermal deposits formation was accompanied by silicification, which took place at a wide temperature ranges from high, moderate and then low temperatures (Meng 1999). Several hydrothermal mineralizations and ore deposits in the Anti-Atlas show the co-existence of silicification alteration (Azmi et al., 2014; Bourque 2016a; El Janati 2019; Hajaj et al., 2023b).
Numerous mineral exploration studies using ASTER data were conducted around the world and particularly in the Anti-Atlas belt of Morocco by applying different image processing methods in the order to enhance hydrothermal alterations zones. Beygi et al. (2021) demonstrated the capability of ASTER data for porphyry copper exploration, his study consists of applying image processing techniques such as specialized band ratio, Selective Principal Component Analysis (SPCA) and Spectral Angle Mapping (SAM) to hydrothermally altered rocks and geological structural features mapping for porphyry copper exploration in the Kacho-Mesqal zone, Urumieh- Dokhtar Magmatic Arc, Iran. Maleki et al. (2021) used ASTER and Landsat-8 data to identify hydrothermal alterations zones and to extract structural lineaments the Qolqoleh-Kasnazan shear zone in Iran. Moreover, the study reveals a major trend of NW-SE for gold mineralization in the study area in which the mineralized zones are associated with iron oxides, argillic, and phyllic alteration is predominant at the margin and away from the center of mineralization zones. El Janati (2019) processed ASTER data using the image enhancement techniques of principal component analysis (PCA), minimum noise fraction (MNF), band rationing (BR), and Mafic index (MI) in the mapping of hydrothermal features in the less studied zone of Taghdout. The results demonstrated the good ability of ASTER data to map ferric iron oxide, as well as argillic, phyllic, silicic, propylitic and carbonate alterations. Atif et al. (2021) applied band rationing, Crosta and mixture-tuned matched-filtering (MTMF) methods using Terra ASTER data to identify different alterations zones in the eastern Anti-Atlas belt of Morocco. Hajaj et al. (2023b) used HyMap hyperspectral data and fuzzy logic modelling for mineral potential mapping, where several image processing approaches were adopted to map the manifestations of Fe3+-Fe2+, Al–OH, and Mg–Fe–OH/CO3 minerals in eastern Kerdous inlier. Mineral detection in the current study area reveals several mineral mixtures which can make their classification a challenging and complex task. Accordingly, the aims of this study are: (1) to identify and the characterization of the hydrothermal alteration zones using band ratio, SPCA techniques and the false color combination; (2) to map spatial distribution of mineral alteration phases using the CEM sub-pixel classification method; (3) to discriminate silicification using TIR bands of ASTER; and (4) to fuse the mineral mapping results for generating mineral alteration map of the study area for cupriferous mineralization exploration.
2. Geological setting of study area
The research area is located at the eastern part of Kerdous inlier more especially in the east of the Ameln valley shear zone, within the western Anti-Atlas belt (Fig. 1). The used geological map (Fig. 1) was digitalized from the Ministry of Industry, Trade, Energy and Mining's Tafraout geological map (1:100 000). The study area consist of a Paleozoic basement covered by the Neoproterozoic and the Adoudounien formations deposited with an angular inconformity (Soulaimani and Ouanaimi 2011). The previous works revealed the deformation polycyclic character of the Proterozoic basement (Hassenforder 1978; Malek et al., 1998; Soulaimani and Ouanaimi 2011). The lithofacies forming the basement are mainly the schist, mica-schist and gneiss. Besides, the Neoproterozoic is represented by quartzites, Pan-African granites of Tafraout, volcanites and ignimbrites. Then, the Tanalt-Ait Baha serie has been materialized by a coarse conglomerates and the alternations of shale and sandstone. A numerous dolerite dykes has been deposited in the region before the Pan-African major phase (Hassenforder 1978). The Paleozoic and Neoproterozoic formations contact is marked by a sub-equatorial dextral shear zone attributed to the pan African orogeny (700–660 M.A.) (Hassenforder 1978). The Adoudounien formations were subdivided into the basal series and the lower series (Fig. 1), this later marks the first stages of the Cambrian transgression (Soulaimani and Piqué 2004).
A polymetallic hydrothermal activity was spatially correlated with the Precambrian basement paleorelief and the tectonique activity during basin opening (Álvaro 2013). Many paleorelief areas was identified in the Western Anti-Atlas, including the study area Fig. 1. Throughout the Anti-Atlas, iron oxides minerals was intimately associated to copper and silver mineralizations, thus it can be applied as an exploration tool to discover new ore deposits (Baidada et al., 2018; Maacha 2013). In the Western-Central Anti-Atlas, the copper mineralization was mainly represented by a stratabound level in the Adoudou basal series hosted by terminal Neoproterozoic to basal Paleozoic formations (Bourque 2016b; Elsass 1975; Maddi et al., 2011; Pouit 1966). Indeed, the copper mineralization genesis was a subject of a critical debate (Bourque et al., 2015; Maacha et al., 2011; Oummouch et al., 2017). Either in relation with diagenetic and synsedimentary processes (Clavel 1971; Guilloux and Pélissonnier 1974), or generated through a synsedimentary process arguing of a strong paleogeographic control of the ores (Bouchta et al., 1977; Pouit 1966; Skacel 1995). In addition, a hydrothermal and epigenetic processes was proposed by (Chazan 1953; Chazan and Fauvelet 1958). The epithermal origin (Alous type) was suggested, where the hydrothermal alteration were associated with sulphides and characterized by the mineral assemblage chlorite-sericite-albite-epidote-quartz (Boyer and Chikhaoui 1978; Chabane and Boyer 1979; Leblanc 1986; Leblanc and Lancelot 1980). The epithermal Copper sulfides were deposited in a context of ignimbritic and mafic volcanism, that was leached from their metallic content by hydrothermal fluids. The mineralized zones are mainly associated in the radial faults during the ignimbrite cooling (Leblanc 1986). While, the superposition of both syngenetic and epigenetic processes where mineralization is controlled by the basement paleogeography then locally remobilized by a tectonic event (Elsass 1975; Pouit 1966). Recently, a genetic link has been proposed between the concentration of copper deposits and the Late Triassic–Early Liassic CAMP (Central Atlantic Magmatic Province) tectono-thermal event (Ouchchen et al., 2023). In eastern Kerdous, the iron oxides-hydroxides, silico-phyllic, argillic/phyllic, and dolomitization hydrothermal alterations were detected (Hajaj et al., 2023b).
) it is a 1T Level data, acquired on October 2, 2004, and covers the whole study area. The scene was registered at-Sensor Radiance and geo-referenced in the UTM 29 projection and a World Geodetic System WGS-84 datum. A cross-talk correction was done on SWIR bands to remove the effects of energy overspill from ASTER band 4 into band 5 and band 9 (Iwasaki and Tonooka 2005). The atmospheric correction was applied by FLAASH module (Fast Line of Sight Atmospherics Analysis of Spectral Hypercubes) (Cooley et al., 2002) using ENVI 5.3 Software.
The SWIR bands have been resampled to 15-m VNIR spatial resolution using nearest neighbor approach, then, the nine ASTER VNIR and SWIR bands have been layer-stacked. The last pre-processing phase consisted in resizing the image into the size of the study area. The TIR bands were corrected using ENVI 5.3 Software by applying the Emissivity Normalization technique for thermal images radiometric calibration. In ENVI 5.3 Software three techniques for separating temperature and emissivity could be performed, including Emissivity From Alpha Residuals, Emissivity From Normalization, and Emissivity From Reference Channel (https://www.harrisgeospatial.com/Software-Technology/ENVI
). In our study, the basic setting is used with a data scale factor of 1 W/m2/μm/sr, a wavelength scale factor of 1 μm, and an assumed emissivity value of 0.96 has been used. This technique is among others used to separate temperature and emission information in radiance data detected with TIR sensors (Haq et al., 2012).
3.2. Data processing
3.2.1. Band Ratios (BR)
The Band Ratio transform is a useful processing technique aiming to reduce topographical effect and highlighting the features that aren't observed in the unprocessed bands (Ali and Pour 2014; Ibrahim et al., 2016; Langford 2015). The Band Ratio is a concise process that involves dividing two bands of maximum reflectance and maximum absorption of the same image pixel (Gupta et al., 2013). In the current study, four Band Ratios were used to map alteration zones in the study area, using ASTER VNIR and SWIR bands. Considering iron oxide/hydroxide minerals including hematite, Goethite, jarosite, and limonite show a significant reflectance within 1.60–1.70 μm (band4) and a high absorption within 0.45–0.52 μm (band2), the band ratio 4/2, highlight iron oxide/hydroxide-rich zones (Pour et al., 2018b). On the other hand, the Band ratio of 4/5 is effective for mapping argillic-altered minerals (Alunite, kaolinite, dickite, and pyrophyllite) following the reflection and the absorption valley in bands 4 and 5, respectively (Pour and Hashim 2012a; Wang et al., 2020). The Band Ratio 7/6 discriminates Phyllic-altered rocks showing usually reflectance spectra of illite, jarosite, and muscovite, which display a high absorption feature of Al–OH that is matched with bands 6 and 7 (Mars and Rowan 2006). The dolomitization-altered zones are mapped using Band Ratio 8/7, this BR is able to depict the Mg–OH/CO3 mineral groups, including dolomite. Dolomite mineral demonstrates absorption features in band 7 (Rasouli Beirami and Tangestani 2020). Furthermore, the Band Ratio 14/12 can be applied to silicification alteration, due to its high sensitivity to detect Quartz-rich rocks (Bedini 2019).
3.2.2. Selective Principal Component Analysis (SPCA)
The SPCA (Crosta technique) is a broadly used method in lithological and hydrothermal alteration features mapping using various remote sensing datasets (Crosta et al., 2003; Crosta and Moore 1990; El-Desoky et al., 2021; Hajaj et al., 2023b; Pour and Hashim 2012b; Pour et al., 2019c). PCA transform is a data dimensionality-reduction method permitting the extraction of the unobvious features in original data. It is a useful linear-transform for remote sensing datasets multidimensional bands (Loughlin 1991), this enhancement method operates by transforming several correlated bands into a new uncorrelated bands called principal components (PCs) containing the compressed information (Crosta et al., 2003; Gupta et al., 2013). Indeed, the determination of the PC image providing the maximum amount of information related to the targeted alteration minerals is based on the examination of PCA eigenvector loadings (Frutuoso et al., 2021; Singh and Harrison 1985). Eigenvector loadings with opposite signs (+ ve or - ve) values indicate a specific spectral responses of targeted materials (absorption or reflectance). In SPCA technique, the PCA transform is assigned to a specific input band. In this study, SPCA has been applied to the VNIR + SWIR and TIR bands of ASTER in order to map the alteration zones associated with iron oxides/hydroxides, argillic, phyllic, dolomitization and silicification HAZs.
Five subsets of bands were selected for this aim. Table 2, Table 3 display the eigenvector matrices resulting from SPCA of the ASTER VNIR, SWIR and TIR bands. Concerning iron oxides/hydroxides minerals, the bands 1, 2, 3 and 4 were used in the selective principal component analysis. Iron oxides/hydroxides minerals exhibit absorption features at (0.40–1.20 μm) corresponding to ASTER bands 1 and 2 (Mars and Rowan 2006; Volesky et al., 2003). Argillic alteration has been determined by the selective PCA applied to bands 6, 4, 3 and 1 (Andongma et al., 2021). Phyllic-altered zones (muscovite and illite) reveals absorption features of Al–OH concentrated at 2.20 μm matched with ASTER band 6 (Bahrami et al., 2021; Mars and Rowan 2006; Moradpour et al., 2020). Thus, the ASTER bands 7, 6, 5 and 4 are appropriate for PCA. In addition, dolomitization is characterized by minerals showing an absorption features at band 7 and 8, while a reflectance in band 4 and 9. The bands 6, 7, 8 and 9 has been selected for dolomitized zones. Silicification alteration is detected using the TIR bands. The bands 10, 12, and 14 were selected for PCA analysis. The quartz-rich zones display high emissivity at 11.31 μm matched with band 14 and a diagnostic features at 8.63 μm and 9.2 μm matched with ASTER band 10 and 12, respectively (Salisbury and Vergo 1991).
Table 1. Eigenvectors calculated from ASTER VNIR and SWIR bands (Abbreviation. Phy: phyllic, Arg: argillic, Dolo: dolomitization).
Eigenvector/AST-iron
Band 1
Band 2
Band 3
Band 4
Eigenvector/AST-Phy
Band 4
Band 5
Band 6
Band 7
PC 1
0.300755
0.493275
0.518296
0.630552
PC 1
0.616195
0.450189
0.457548
0.456381
PC 2
0.516984
0.399884
0.205581
−0.728394
PC 2
0.738220
−0.261170
−0.608391
−0.129156
PC 3
0.507698
0.208953
−0.797562
0.249954
PC 3
0.249489
0.051738
0.460977
−0.850046
PC 4
0.620095
−0.743715
0.230220
0.096799
PC 4
0.114408
−0.852317
0.456082
0.229034
Eigenvector/AST- Arg
Band 1
Band 3
Band 4
Band 6
Eigenvector/AST-Dolo
Band 6
Band 7
Band 8
Band 9
PC 1
0.276466
0.504652
0.659736
0.483365
PC 1
0.504146
0.496781
0.474804
0.523074
PC 2
0.663828
0.515089
−0.438745
−0.318621
PC 2
0.289895
−0.648603
−0.319810
0.626894
PC 3
0.466453
−0.467045
−0.331937
0.673875
PC 3
−0.812928
0.055073
0.210388
0.540233
PC 4
0.515093
−0.511741
0.511927
−0.459055
PC 4
0.030753
−0.574011
0792477
−0.203828
Table 2. Eigenvectors calculated from ASTER TIR bands.
Eigenvectors
Band 10
Band 12
Band 14
PC 1
0.692575
0.720284
−0.039128
PC 2
0.718158
−0.683405
0.131173
PC 3
−0.067742
0.118947
0.990587
Table 3. Confusion matrix.
Empty Cell
Reference
Empty Cell
Silicification
Argillic/Phyllic
Iron oxides/hydroxides
Dolomitization
None
Total
Silicification
5
0
0
0
1
6
Argillic/Phyllic
0
7
0
0
3
10
Iron oxides/hydroxides
0
0
6
0
0
6
Dolomitization
3
0
0
4
7
14
Total
8
7
6
4
11
36
OA
61.11%
Geographic Information System (GIS) technologies have been utilized to create integrative maps using digital overlay approaches in mineral potential mapping (MPM) (Abdelkareem et al., 2018). The current investigation uses BR and SPCA resulted layers input for weighted overlay modelling (see Fig. 2).
Fig. 2. The present investigation methodology flowchart for ASTER data processing.
3.2.3. Constrained Energy Minimization (CEM) technique
The CEM is a broadly used sub-pixel classification, it provides a good ability to map minerals based on multispectral imagery (MSI) (El-Desoky et al., 2021; Pour et al., 2018b; Pour et al. 2019a; Pour et al. 2019b; Seifi et al., 2021). Before the wide use of CEM in the target mapping, it was proposed for the first time in signal processing by Harsanyi to solve the classic problem of adaptive beamforming (Farrand and Harsanyi 1997). CEM technique possesses the capability to classify minerals, necessitating only the knowledge of the target spectra to be detected, resembling the Matched Filtering algorithm. The advantage of the CEM use is to constrain the targeted material signature, while minimizing the effect from unknown materials sigturures (Harsanyi 1993).
Assume (r1, r2… rN) is the remote sensing image with N pixels. Each pixel, ri = (ri1, ri2… riL) T, is an L-dimensional column vector, where L is the number of bands. We suppose that d as the target material spectral signature to be detected. CEM goal is to design a Finite Impulse Response (FIR) linear filter that is used in the linear constraining of the target with unknown signal minimum interference (Harsanyi 1993). FIR has been given by the vector w = (w1,w2, …,wL)T. By using two constraints, CEM operator can be defined as follow:
One constraint requires that the output energy of the operator is unity when applied to the target spectral signature d = (di1, di2… diL) T, the constraint equation (1) is given by:(1)
The other constraint minimizes the total output energy of all image pixels. For an i-th image pixel ri, the summed energy (FIR filter output) across the image bands can be represented by a scalar value yi (equation (2)):(2)
For all input (r1, r2… rN), the average output energy is given by
.
Thereafter, the objective is to find a weight vector w satisfying the twofold constraint at once. Constrained Energy Minimization (CEM) classifier with the weight vector w* given by the following equation (3) can solve this problem:(3)
CEM filter as a detector δ(r) can be calculated by:(4)
Therefore, equation (4) calculates the fractional abundance amount by the δ(r) value of the object signature d in the image pixel r. R is the L x L sample correlation matrix of the observation pixel vectors from the area of interest. The sample correlation matrix of the observation vectors is given by
. In the current study, CEM was employed on the ASTER nine VNIR/SWIR bands image, wherein the USGS spectra of the target minerals were resampled to match the ASTER resolution (section 4.1.3).
4. Results
4.1. Mineral and hydrothermal alteration mapping
4.1.1. Alterations features detection findings using Band Ratios (BR)
Fig. 3, Fig. 4, Fig. 5, Fig. 6, Fig. 7a show the results of the five performed BRs. The results of BRs are a grey scale images, where the bright pixels show the high mineral abundance. Thereafter, a threshold segmentation process was applied to all the resulted alteration images in the order to detect the severe alteration zones, where the mean + 2.5*σ (where σ denotes the standard deviation and n > 0) value was used (Wang et al., 2020). The ratio of bands 4/2 was applied to discriminate areas of abundant iron oxide minerals as bright pixels, then, the severe alteration was mapped in red pixels after thresholding (Fig. 3a). The ratio of bands 4/5 was used to highlight areas of abundant clay minerals (argillic-altered zones) as bright pixels, while the severe alteration was mapped in yellow (Fig. 4a). Phyllic alteration zones were highlighted by bright pixels using the ratio of bands 7/6, then the severe alteration was mapped in clear green yellow (Fig. 5a). Well, ratio of bands 8/7 was used to highlight areas of abundant dolomitization as bright pixels (Fig. 6a), where blue show the severe alteration. Fig. 7a shows the 14/12 BR image the bright pixels highlight silicification, where the severe alteration was mapped in cyan.
Fig. 3. ASTER band ratio (up) and SPCA (down) derived thematic maps highlighting the hydrothermally altered zones of iron oxide/hydroxide. The previously detected mineral prospectivity potential zones using HyMap (Hyperspectral Mapper) have been delineated in yellow rectangles.
Fig. 4. ASTER band ratio (up) and SPCA (down) derived thematic maps highlighting the hydrothermally altered zones of argillic alteration. The previously detected mineral prospectivity potential zones using HyMap (Hyperspectral Mapper) have been delineated in yellow rectangles.
Fig. 5. ASTER band ratio (up) and SPCA (down) derived thematic maps highlighting the hydrothermally altered zones of phyllic alteration. The previously detected mineral prospectivity potential zones using HyMap (Hyperspectral Mapper) have been delineated in yellow rectangles.
Fig. 6. ASTER band ratio (up) and SPCA (down) derived thematic maps highlighting the hydrothermally altered zones of dolomitization alteration. The previously detected mineral prospectivity potential zones using HyMap (Hyperspectral Mapper) have been delineated in yellow rectangles.
Fig. 7. ASTER band ratio (up) and SPCA (down) derived thematic maps highlighting the hydrothermally altered zones of silicification alteration. The previously detected mineral prospectivity potential zones using HyMap (Hyperspectral Mapper) have been delineated in yellow rectangles.
FCC images interpretations dependent on the mode of assignment of used bands to three primary colors Red, Green and Blue (RGB), which are function of the spectral features of target minerals (Ibrahim et al., 2016). The RGB images will distinguish altered and unaltered material as well as reveal areas of mineral concentration (Frutuoso et al., 2021; Sabins 1999). The BRs 4/5.7/6.8/7 were assigned to RGB FCC respectively (Fig. 8a), the zones with both phyllic and argillic alterations were mapped by yellow. The 4/2.7/6.4/5 as RGB color composite image highlights iron oxide/hydroxide, phyllic and argillic with bright pixels (Fig. 8b), well as the admixture of phyllic and argillic alteration with cyan tone. Besides, the magenta color reveals the zones with both iron oxide/hydroxide and argillic alterations. Well, the RGB Color composite image of BRs 4/2.4/5.8/7 (Fig. 8c) distinguishes the iron oxide/hydroxide and argillic alterations zones by yellow green color, while the magenta color maps the altered zones whit both iron oxide/hydroxide and dolomitization alterations. Last, the RGB Color composite of BRs 8/7.7/6.4/2 (Fig. 8d) distinguishes the iron oxide/hydroxide and phyllic alterations with cyan color. Besides, the magenta color highlights the zones with both oxide/hydroxide and propylitic alterations within volcanites and ignimbrites as well as Tanalt Ait Baha serie units.
Fig. 8. The FCC images generated for the ASTER BRs. BRs 4/5.7/6.8/7 as RBG FCC (a). BRs 4/2.7/6.4/5 as RGB FCC (b). BRs 4/2.4/5.8/7 as RGB FCC (c). BRs 8/7.7/6.4/2 as RGB FCC (d).
4.1.2. Selective PCA (SPCA) method results
The eigenvector matrix of bands 1, 2, 3 and 4 for Iron oxides/hydroxides minerals was calculated (Table 1). The analysis of eigenvectors loadings indicate that PC2 is appropriate for mapping Iron oxides/hydroxides minerals because of the high negative loading (−0.728394) in band 4 (reflectance band) and a moderate positive loading (0.516984 and 0.399884) in bands 1 and 2, (absorption bands) respectively. The negation of PC2 image allow the mapping of the Iron oxides/hydroxides minerals by bright pixels. The pseudo-color ramp of the PC2 image is showed in Fig. 3b, where high abundance of iron oxide/hydroxides was highlighted by blue color within quartzites especially in north-western part of study area, basal schist and sand stone, basal limestone and dolomite lithounits. While, low/moderate distribution (reed color) is identified in lower limestone and dolomite, Pan-African granites, gneiss and ultimate conglomerate lithological formations.
The bands 1, 3, 4 and 6 eigenvector matrix used for identifying argillic alteration minerals is shown in Table 1, argillic alteration minerals can be discriminated in bright pixels by the negation of PC3, because of the negative contribution in the reflectance bands 3 (−0.467045) and 4 (−0.331937), while the high positive contribution (0.673875) in band 6 (absorption band). Fig. 4b shows that the high abundance of argillic alteration minerals was mapped in quartzite and in the ultimate conglomerates. While, a moderate distribution is remarkable in southern part of the Jbel Ouiharen gneisses, Pan-African granites, dolerite and lower limestone and dolomite formations.
The analysis of the eigenvector loadings using bands 4, 5, 6 and 7 (Table 1) permits the identification of the phyllic alteration. PC2 contains information about phyllic alteration minerals, due to the high negative contribution (−0.608391) in band 6 (absorption band) and the strong positive contribution (0.738220) in band 4 (reflectance band), with a weak negative contribution (−0.129156) in the low reflectance band 7, thus the regions with phyllic alteration should appear in bright pixels in PC2 image. Besides, the pseudo-color ramp of the PC2 image (Fig. 5b) highlights the high abundance of phyllic alteration minerals with blue tone. According to the analysis of argillic alteration minerals distribution (Fig. 5b), we can notice that argillic and phyllic alteration minerals show a high similarity in term of its spatial distribution, with demonstrate little differences such as the relative weak abundance of phyllic alteration minerals in lower limestone unit and in quartzite northern study area.
Dolomitization shows absorption valley in ASTER band 7 and 8. Considering the extracted eigenvectors loadings using bands 6, 7, 8 and 9 (Table 1), PC2 is suitable for mapping dolomitization alteration minerals due to the negative loadings in bands 7 (−0.648603) and 8 (−0.319810), as well as the positive loadings in bands 6 (0.289895) and 9 (0.626894). Hence, PC2 allows the dolomitization mapping by bright pixels; Fig. 6b shows the pseudocolour ramp of PC4 image. High special distribution of dolomitization alteration is detected in carbonates (basal dolomite and limestone and, lower dolomite and limestone formations).
The analysis of eigenvector matrix of bands 10, 12, 14 (Table 2) demonstrated that the PC1 negation can allow to map silicification alteration, following the negative loading in band 14 (−0.039128) and the positive loading in band 10 (0.692575) and band 12 (0.720284). The pseudocolor ramp of PC1 is represented in Fig. 7b, showing silicification alteration in blue after the negation of the resulted PC1 grey scale image. We can notice that silicification alteration was generally concentrated in the Jbel Lkest Quartzites formations, extremely around doleritic dykes.
4.1.3. Mineralogical detection and mapping results based on the CEM classifier
The CEM was adopted for a detailed mineral mapping in the study area. Indeed, each single alteration zone exhibits a number of minerals that are typical. Appling the CEM method, the diagnostic absorption features of alteration minerals in the nine VNIR and SWIR ASTER bands can be exploited for mineral mapping and identification (Pour et al., 2019a). The mineral map of the eastern AVSZ in this study was carried out based on CEM sub-pixel classification (Fig. 12b), where eight minerals were targeted and selected based on previous studies in the region using hyperspectral data and N-D visualizer technique (Hajaj et al., 2023b). Fig. 9 displays the USGS library resampled spectra to ASTER resolution. Kaolinite has a primary Al–OH absorption at band 6 and a secondary absorption at bands 5, as well as the alunite has a marked absorptions at bands 5 and 6 of ASTER, while it can show additional absorption at ASTER band 1 (Pour et al., 2019b). Montmorillonite exhibits Al–OH absorption features at ASTER bands 5, 6. As shown in Fig. 9Illite has a deep absorption at band 6 of ASTER, this latter exhibits a low reflectance in the first three ASTER bands (Pour et al., 2019b). In addition, dolomite has a CO3 and Mg–O–H absorption valley in bands 7 and 8 of ASTER. Besides, hematite and goethite have strong Fe3+ absorption feature at bands 1 and 3 (Moradpour et al., 2020). Pyrophyllite exhibits deep absorption in ASTER band 5, as well as topaz shows absorption features in ASTER band 5 (Fig. 9). As remarked in Fig. 11, minerals spectras of study area ASTER scene exhibit some differences compared to the USGS spectra, what is observed in the redundant absorption at ASTER band 8 related to Mg–O–H attributed mainly by carbonates (Alimohammadi et al., 2015; Di Tommaso and Rubinstein 2007). Thus, the hydrothermal alteration process complexity in the study area could make more difficult the mineral identification and mapping task. Well, Fig. 9 shows the fraction images of each Endmember (mineral) derived from CEM algorithm. The high fractional abundance (confidence = 98%) of pyrophyllite was represented in green, kaolinite in dark reed; illite in yellow; montmorillonite in cyan color; topaz in reed; hematite in purple, dolomite and muscovite in blue (see Fig. 10). Moreover, Fig. 11 shows the spectral profiles of some ASTER image pixels in the mapped hydrothermally altered rocks and their corresponding USGS reference spectra. Thereafter, the final map using CEM is shown in Fig. 12b. Furthermore, the mineral distribution was concentrated in a specific areas demonstrating a major compliance with the BR, FCC and SPCA results.
Fig. 9. The laboratory reflectance spectra (USGS spectral library) of alteration minerals and their corresponding resampled spectra to ASTER spectral resolution. The thin lines exhibit the ASTER VNIR and SWIR bands position in the range 0.5–2.5 μm.
Fig. 10. Grey-scale CEM rule images of the following minerals, a. Pyrophyllite, b. Kaolinite, c. Illite, d. Montmorillonite, e. Topaz f. Hematite, g. Dolomite, h. Muscovite. CEM was applied with confidence 98%.
Fig. 12. Mineral mapping results in eastern Amlen valley shear zone using ASTER data, (a). Hydrothermal alteration zones map, (b). Mineralogical map performed using CEM technique. Abbreviation: Hyd Alteration: Hydrothermal Alteration, Ox-Hyd: Oxides and hydroxides.
4.1.4. Hydrothermal alteration and silicification GIS-based modeling
Weighted overlay is a widely used method for mineral potential mapping in GIS environments (Alarifi et al., 2022; Hegab et al., 2022). To simulate appropriateness in a geographic analysis, ArcGIS employs this method by assigning weights to each raster layer in the model. The raster data is classified using a standard suitability scale, and the suitability values of each cell are calculated by multiplying it by the weight of its respective layer (Hegab et al., 2022). The sum of these weighted values results in a total suitability value, which is written to new cells in the output layer. The symbology of the output layer is then based on these suitability values. In our investigation, the weighted overlay model has been performed using the 10 layers resulted from BR and SPCA techniques (Fig. 3, Fig. 4, Fig. 5, Fig. 6, Fig. 7) after reclassification, where, The 10 layers were weighted equally in weighted overlay strategy. Thus, the modelling task allows to extract a map of hydrothermal alterations in the study area with 5 classes (see Fig. 13).
Fig. 13. Hydrothermal alterations map of east Kerdous inlier performed by the integration of alterations and silicification.
4.2. Fieldwork, XRD analysis, and assessment of hydrothermal alterations mapping results
Several detected prospects with high mineralogical interest were visited, where various altered units were photographed and sampled as shown in Fig. 14. Indeed, Quartzites unit demonstrates a high amount of alteration (Fig. 14a–f). Hematite mineral is relatively more detected in the Quartzites of Jbel Lkest, where Fig. 14a shows a hematitized sample from the north of research area. As well, Clay minerals were identified principally in the Quartzites lithofacies either in association with some faulted regions, as represented in Fig. 14b. Accordingly, Fig. 14c–e, and f shows the aspect of altered quartzites lithounit within the AVSZ. Besides, Quartz veins occur with a sub-equatorial to ESE-WNW direction in high to medium silicification zones with some iron oxides (Fig. 14d). Basal series show a considerable abundance of Iron oxide/hydroxides minerals. Fig. 14g shows a highly dolomitized limestone in basal series hosting hydroxides minerals. Fieldwork, GPS survey, and XRD analysis were used to verify the alteration zones occurrences and to build a confusing matrix for accuracy assessment. XRD analysis of the representative samples collected from the hydrothermal alteration zones. Following XRD results, Alunite, Albite, clinochlore, chlorite, dolomite, hematite, illite, kaolinite, montmorillonite, muscovite, and quartz have been identified in iron oxide/hydroxide zone, argillic/phyllic, and dolomitization alteration zones (Fig. 15). On the basis of field observations an overall accuracy (OA) of 61.11% was obtained for the mapping of argillic/phyllic, iron oxides/hydroxides, dolomitizarion, and silicification alterations (Fig. 12) as observed in Table 3.
Fig. 14. Field Photographs of the hydrothermal alteration zones in the study area; (a) Hematitized quartzites northern study area; (b) Clay minerals-rich quartzite showing a strong tectonic effect; (c) the difference in appearance between altered quartzite approximated to the AVSZ and less altered quartzites far from the AVSZ; (d) Quartz vein within quartzites; (e) panoramic view of A highly altered sub-equatorial quartzites lens hosting Fe-bearing minerals; (f) argillic and phyllic altered region in quartzite near of a dolerite dyke; (g) High dolomitization zone in basal serie carbonates showing hydroxide minerals.
Fig. 15. XRD patterns of representative samples collected from hydrothermal alteration zones. Iron oxide/hydroxide zone (A), argillic/phyllic alteration zone (B, C, D, and F); dolomitization zone (A and E); Abbreviations: Alu: Alunite, Alb: Albite, Cl: Clinochlore, Chl: Chlorite, Dt: Dolomite, Hem: Hematite, Ill: Illite, Kao: Kaolinite, Mont: Montmorillonite, Mu: Muscovite, Qz: Quartz.
5. Discussion
The use of remote sensing techniques permits the identification of hydrothermally altered rocks which are considered as a valuable exploration zones in mining prospection (Pour et al., 2018a). In the Anti-Atlasic metallogenic province silicification can be observed associated with cupriferous mineralizations of Precambrian basement vein structures (Bourque 2016b). Within the scope of this investigation, the global distribution of iron oxides/hydroxides minerals, as well as phyllic, argillic, dolomitization and silicification alterations were detected using BR and SPCA techniques. Furthermore, the sub-pixel abundance identification of pyrophyllite, kaolinite, dolomite, illite, montmorillonite, hematite, muscovite and topaz was done for a detailed mineral mapping. The interpretation of the various remote sensing techniques including BR, SPCA and CEM, as well as alterations and silicification spatial analysis using GIS-overlay analysis contributes to a good understanding of the hydrothermal alterations within the study area.
The BR and SPCA results comparison demonstrated a major similarity in almost all the types of hydrothermal alterations. The BR and SPCA of ASTER bands provides an overview of HAZs characteristics in the study area. The (4/2.7/6.4/5) RGB Color composite can be considered as the best FCC for our study area, following its identification of iron oxide/hydroxide minerals, phyllic and argillic HAZs intersection in clear tone, well the overlapping between argillic and phyllic alterations is clearly demonstrated with cyan color using this later. High abundance of iron oxide/hydroxides was mapped in quartzites especially in north-western part of study area and within the basal series. Moreover, the abundance of Fe-bearing minerals (Goethite) in basal series in the contact with the Cambrian carbonates is very comparable with the other ore deposits within Kerdous inlier such as the stratabound Cu–Ag ore of the Agoujgal mine (Maddi et al., 2011) southern the inlier as well as a considerable abundance is detected in the Cambrian carbonates (lower limestone and dolomite). Whereas, goethite occur in carbonates, particularly with dolomite, surrounding the growth steps of the crystals. This latter is hosting a large part of the Ouansimi vein type copper mineralization (El Basbas et al., 2020). Whereas, an oxidation crust in granites is detected using BR and Crosta techniques what made difficult the iron-bearing minerals prospection. The argillic and phyllic alterations print generally the AVSZ, which confirms the tectonic control of hydrothermal alterations (Hajaj et al., 2023b). In comparable regions in the western Anti-Atlas, a fault-driven epigenetic polymetallic hydrothermal systems were reported (Álvaro 2013). The cupriferous mineralization in these systems is essentially attributed to a late Ediacaran syn-rift/post-rift transition, where the mineralization is concentrated in the base of the Adoudou lower series. Quartz, dolomite, calcite and iron oxides/hydroxides were observed associated with cupriferous mineralization, which suggests a paleorelief related control.
The argillic/phyllic alteration overlapping and mixing was demonstrated in other parts of Anti-Atlas belt (Atif et al., 2021). Numerous hydrothermal alteration minerals were identified and mapped using HyMap data and verified with petrographic and XRD analyses, including kaolinite, pythpyllite, illite, hematite, dolomite, topaz, muscovite, and montmorillonite (Hajaj et al., 2023b). From a structural viewpoint, the study area was structurally controlled essentially during the Pan-African and Eburnean orogen, and four main tectono-magmatic phases were reported (Hassenforder 1987). The use of remote sensing and automatic lineaments extraction in the study area reveals the dominance of NE-SW structural lineaments trend (Hajaj et al., 2022). Previous mineral potential mapping studies in the study area integrated structural factor represented by both faults and high-resolution tectonic lineament maps (Hajaj et al., 2023b). However the present work findings as well as the hydrothermal alterations map (Fig. 13) show a great correlation between ASTER-derived high alteration zones and HyMap-derived mineral potential zones.
Furthermore, the hydrothermal alteration features mapping using aster data shows an OA = 61.11%, which can be considered as a satisfactory and exploitable findings, taking in to consideration the major complexity of alteration features in the study area as well as the numerous previously detected mineral mixtures (Hajaj et al. 2023a, 2023b). To sum up, the present study methodology can be used in hydrothermal alteration features detection and mapping in similar geological contexts. The current study results will support the future works in the investigation in area using advanced machine learning algorithms for lithological/mineralogical classification. Remotely sensed data processing will provide a comprehensive insights about alterations and lithology to support the mineral exploration program in the western Anti-Atlas belt.
6. Conclusion
In this investigation, the hydrothermally altered zones were discovered using several image processing methods, including SPCA, BR and CEM. In fact, the mineralogical mapping process reveals several spectral mixtures that can be occurred in some region which can be due to alteration process complexity and the presence of several minerals with comparable chemical compositions. Accordingly, the mineral mixtures as well as the chemical composition similarities induce a considerable difficulty in distinguishing alterations using MSI data. However, The ASTER fourteen bands from VNIR, SWIR and TIR spectral ranges allowed a reasonable identification/classification of the alteration zones in the semi-arid region of eastern Ameln Valley. The argillic, phyllic, propylitic and silicification alterations, as well as the iron oxides/hydroxides minerals were highlighted with a considerable accuracy (OA = 61.11%).
Indeed, the developed mineralogical/hydrothermal alteration maps can be exploited by researchers in further studies for a better understanding of cupriferous mineralization (lower-Paleozoic cover mineralization) in the western Anti-Atlas metallogenic province. Thus, the used method in this research can be applied to track the hydrothermally altered areas in the Anti-Atlasic belt.
Funding
The authors claim to have received no financial support for this research.
The authors declare that they have no known competing financial interests or personal relationships that could have appeared to influence the work reported in this paper.
The authors declare the following financial interests/personal relationships which may be considered as potential competing interests:
The authors declare that they have no known competing financial interests or personal relationships that could arise and influence the work presented in this article. It is important to note that all the authors have made an equal contribution to the manuscript and that they have approved the final form of it.
The Advanced Spaceborne Thermal Emission and Reflection Radiometer (ASTER): data products for the high spatial resolution imager on NASA's Terra platform
Application of ASTER data for exploration of porphyry copper deposits: a case study of Daraloo–Sarmeshk area, southern part of the Kerman copper belt, Iran
Mapping alteration minerals at Malmbjerg molybdenum deposit, central East Greenland, by Kohonen self-organizing maps and matched filter analysis of HyMap data
Le cuivre de l'Anti-Atlas, un problème complexe: synthèse des occurrences cuprifères de la boutonnière de Bou Azzer-El Graara et nouvelles données (Anti-Atlas, Maroc)
H. Bourque, L. Barbanson, S. Sizaret, Y. Branquet, C. Ramboz, A. Ennaciri, M. El Ghorfi, L. Badra
A contribution to the synsedimentary versus epigenetic origin of the Cu mineralizations hosted by terminal Neoproterozoic to Cambrian formations of the Bou Azzer–El Graara inlier: new insights from the Jbel Laassel deposit (Anti Atlas, Morocco)

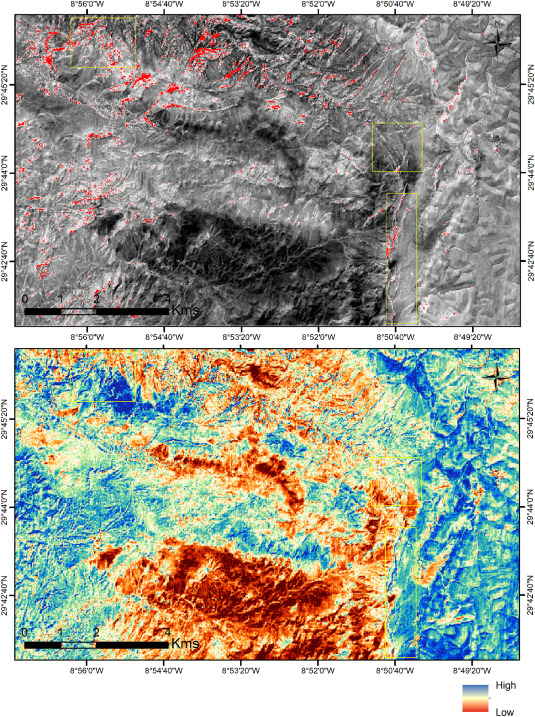
 Fig. 1


